
Download project planning excel template of Gantt Chart.
Gantt charts are used in project management for planning and scheduling purposes, and they can be useful for projects of varying sizes. They’re great for getting a feel for a project before diving in headfirst. The tasks and dates for a project are shown graphically in a Gantt chart.
By arranging project tasks on a visual timeline, Gantt charts make it simple for project, program, and portfolio managers to sketch out project plans. However, there are numerous other uses for Gantt charts, including resource management, project scheduling, and tracking.
For more information about how to download template, check Gantt Chart in Project execution plan templates in categories.
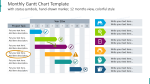
Weekly Gantt chart planning in project template
Gantt chart usually using to made up of a spreadsheet that is use to tasks list and stacked bar chart, which present the project timeline. A Gantt chart template is visual project management tool that help project managers to visualize the project tasks, which made a schedule.
Weekly project Gantt chart templates make it easier to schedule, plan and weeks to create a unique timeline. Using this template, you can edit the chart in the progress; this way your term will quickly understand who needs to do what or when.
How to make a weekly Gantt chart?
You can create Weekly Gantt chart in Gantt Excel in a minutes. To create a Gantt chart, click on the Weekly View button in the Gantt menu. Weekly view will render instantly with the calendar display all the weeks in a year.
Gantt Excel gives you the ability to see the every step of your project from start day to the end day of the week. This weekly Gantt chart makes the project plan easier and schedule. You can also have the ability to select the week workdays and weekend to define a custom work end.
Simply plug in your tasks dates and resourced, you will have a presentation quality Excel Gantt chart.
Related Template: Project Work Plan Template Excel

Construction project Gantt chart Template
A Gantt chart is a project management tool assisting in the planning schedule of all the size of projects. A Gantt chart provides a visual overview of all the construction tasks and timeframe. It lets you quickly see who is working on which duty and which your team already to finish. It can also provide the full transparency to all the stakeholders.
How to make a work schedule for construction project?
- Collect each variables information
- Identifying stakeholders
- Estimate timeline
- List tasks
- Assess the schedule
- Delegates tasks
- Plan for challenges
- Updates for project proceeds.
Multiple Projects Gantt chart Planner
Use Gantt chart to track multiple projects and view each project in timeline. This template provides you a quick overview of important data for different projects at a glance.
There are several strategies to keep track and manage multiple projects.
- Firstly plan before start anything
- Use every tool you have disposal
- Adjust your plan through regular overview
- Prioritize tasks
- Stay focus
- Know when you delegate
- Communicate with team members
When you work on the multiple projects, you can instead of opening one by one, you can open subprojects at the same time when you open the master project. Multi projects management refers to programs and project portfolio. Project management has comes with methodologies to manage these called program and portfolio management.
Related Template: Project Documentation Template Excel
Simple Gantt Chart Project Plan
A Gantt chart is a graphical representation activity against time of a project management. A Gantt chart assists in the planning and schedule of a project in all sizes. Gantt chart essentially task schedule tools that are projects management timeline and tasks are convert into a horizontal bar. These horizontal bars are called the Gantt bars. These Gantt bars show the start and end dates as well as dependencies, schedule and deadlines.
A timeline like Gantt chart is useful to keep tracks on track when there is a large team and multiple stakeholders.
How to create a simple Gantt chart
- Open your project File
- Enter project plan
- Add Gantt chart Wizard
- Customize the Gantt chart
- Select Gantt chart template
- Make your Own
- Customize your Gantt chart
Timeline
- Start Date
- End Date
- Duration in Days
Project Notes
- Schedule
- Budget
- Resources
- Risks
- Issues
- Comments
|
Visual Representation |
Task Listing |
|
Time Allocation |
Dependencies |
|
Duration Estimation |
Resource Allocation |
|
Milestones |
Progress Tracking |
|
Resource Overlaps |
Project Planning and Scheduling |
| Historical Data |
Integration with Project Management Software |
Gantt Project Planner
The template elaborates on the following set of information:
Project Name
- Project Manager
- Start Date
- End Date
- Overall Progress
- Project Deliverable
Related Template: RACI Chart Excel Template Download
PROJECT PLAN DASHBOARD WITH GANTT CHART
A project dashboard is a project management tool use to keep track key performance indicators for various projects. Dashboard can also show the display progress report and highlight areas that require attention. Project plan dashboard monitors the success of specific campaigns, processes and projects.
A project dashboard is the collection of key data, qualitative information and visualization. A project dashboard is easy way to communication with key details. Gantt chart allows you to view the entire project and their milestones and tasks on a single page.
Benefits of Gantt Chart in Project Planning
There are many benefits to using Gantt charts, but the following five stand out as particularly useful:
Gantt chart is use to visualize the building blocks of a project. It can also help to organize it into smaller and more manageable.
Benefits
- Provides high level Overview
- Allows Better Tracking
- Illustrates overlaps and Dependencies
- Boosts Productivity
- Balance Multiple Project
- Manage complex Information
- Set realistic Deadlines and expectation
- Motives team member
A Gantt chart helps in scheduling, managing and monitoring specific tasks and resources in a project. Gantt chart helps you assess how long a project should take determine the resources needs and plan the order.
Related Template: Project Implementation Plan Template Excel + Word
You can also download Template: Agile Project Plan Template Excel

Key Features of Gantt Chart Templates
A Gantt chart has two main sections
- The vertical axis shows the list of tasks
- The horizontal axis represents the timeline.
Each bar represents the task and length show the task should start and end time. A good Gantt chart include the name or description of the project, resources assign in each task and a start and end date of each task.
Elements of Gantt chart
- Resources
- Tasks
- Milestones
- Dependencies
How to Project Planning through Gantt Chart Template in Excel?
Excel has a Gantt chart template that can use for project planning. Excel template allows you to enter start dates, the project duration and tasks progress. It can use to make the project easy. A Gantt chart is the ideal tool to coordinate groups of people, simultaneous of goals and keep all aspects of play move. Gantt chart template is an easy tool to make your tasks colorful as detail as your organization heart desire.
How to create a project plan Gantt chart in excel?
- List your project schedule
- Set it up by as a Stacked bar
- Add the Start date of your Gantt chart plan
- Add the duration task time
- Add the description